Behavioral Health Visualization
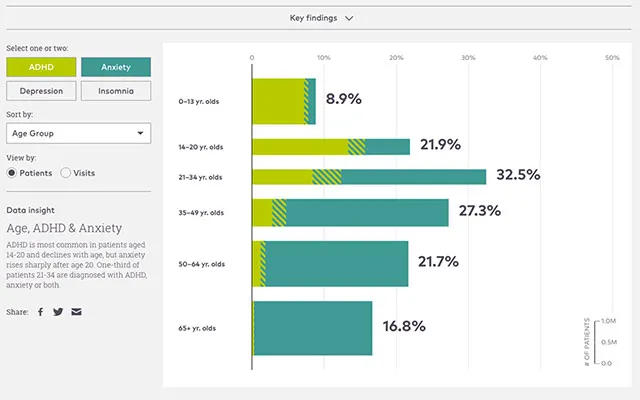
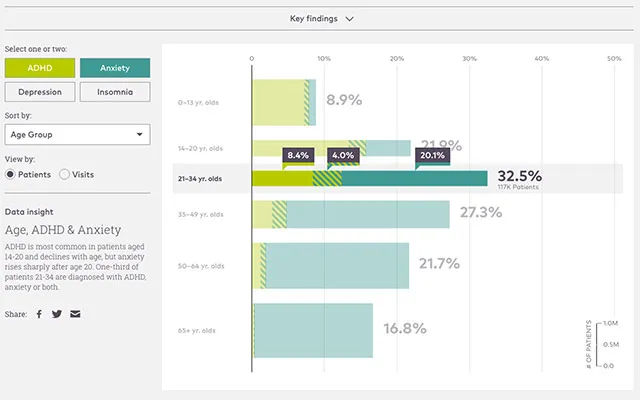
We created a web based interactive dataviz application that visualizes a health network's patient data by demographics and diagnoses. Viewers can navigate the data by using the controls to change the data comparisons.
Role:
Parsing and data interpretation. Chart visualization with D3.js as well as hover/click overlays.
Tools:
Javascript, D3.js, webpack, less